
Last year, the first few months of data from the US grid suggested that fears of a data-center-driven surge in demand were becoming a reality. Demand had risen by about 3 percent, triggering a surge in coal, interrupting what had been a long downward trend. But over the course of the year, both trends slowed considerably.
A year later, all of that seems to be in the past, as the US has returned to its normal pattern: slow growth, with renewables pushing coal off the grid. The one oddity is that hydroelectric production has surged without a corresponding increase in capacity, likely due to unusually warm weather in the western US causing the snowpack to melt early. That may have consequences later in the year.
Pushing fossil fuels out
Overall demand in the US grew by only 1.5 percent in the first quarter of 2026 compared to the same period the year before. Often, changes in demand during this part of the year are driven by weather-related heating demand. But the US had an unusual combination set of weather conditions to start 2026, with the western half baking in unseasonal warm temperatures, while the eastern half suffered a deep freeze. So we’ll probably need data from more of the year before we read too much into the small rise in demand we’ve seen so far.
As has been the case for a while now, the biggest trend on the US grid was the growth of solar. Compared to the same quarter the year earlier, solar was up by 24 percent. On its own, that was enough to offset 80 percent of the rising demand. Overall, the output of the major renewables (wind, solar, and hydro) grew by 11 percent compared to the same period the year prior, or about 1.8 times the growth in demand.
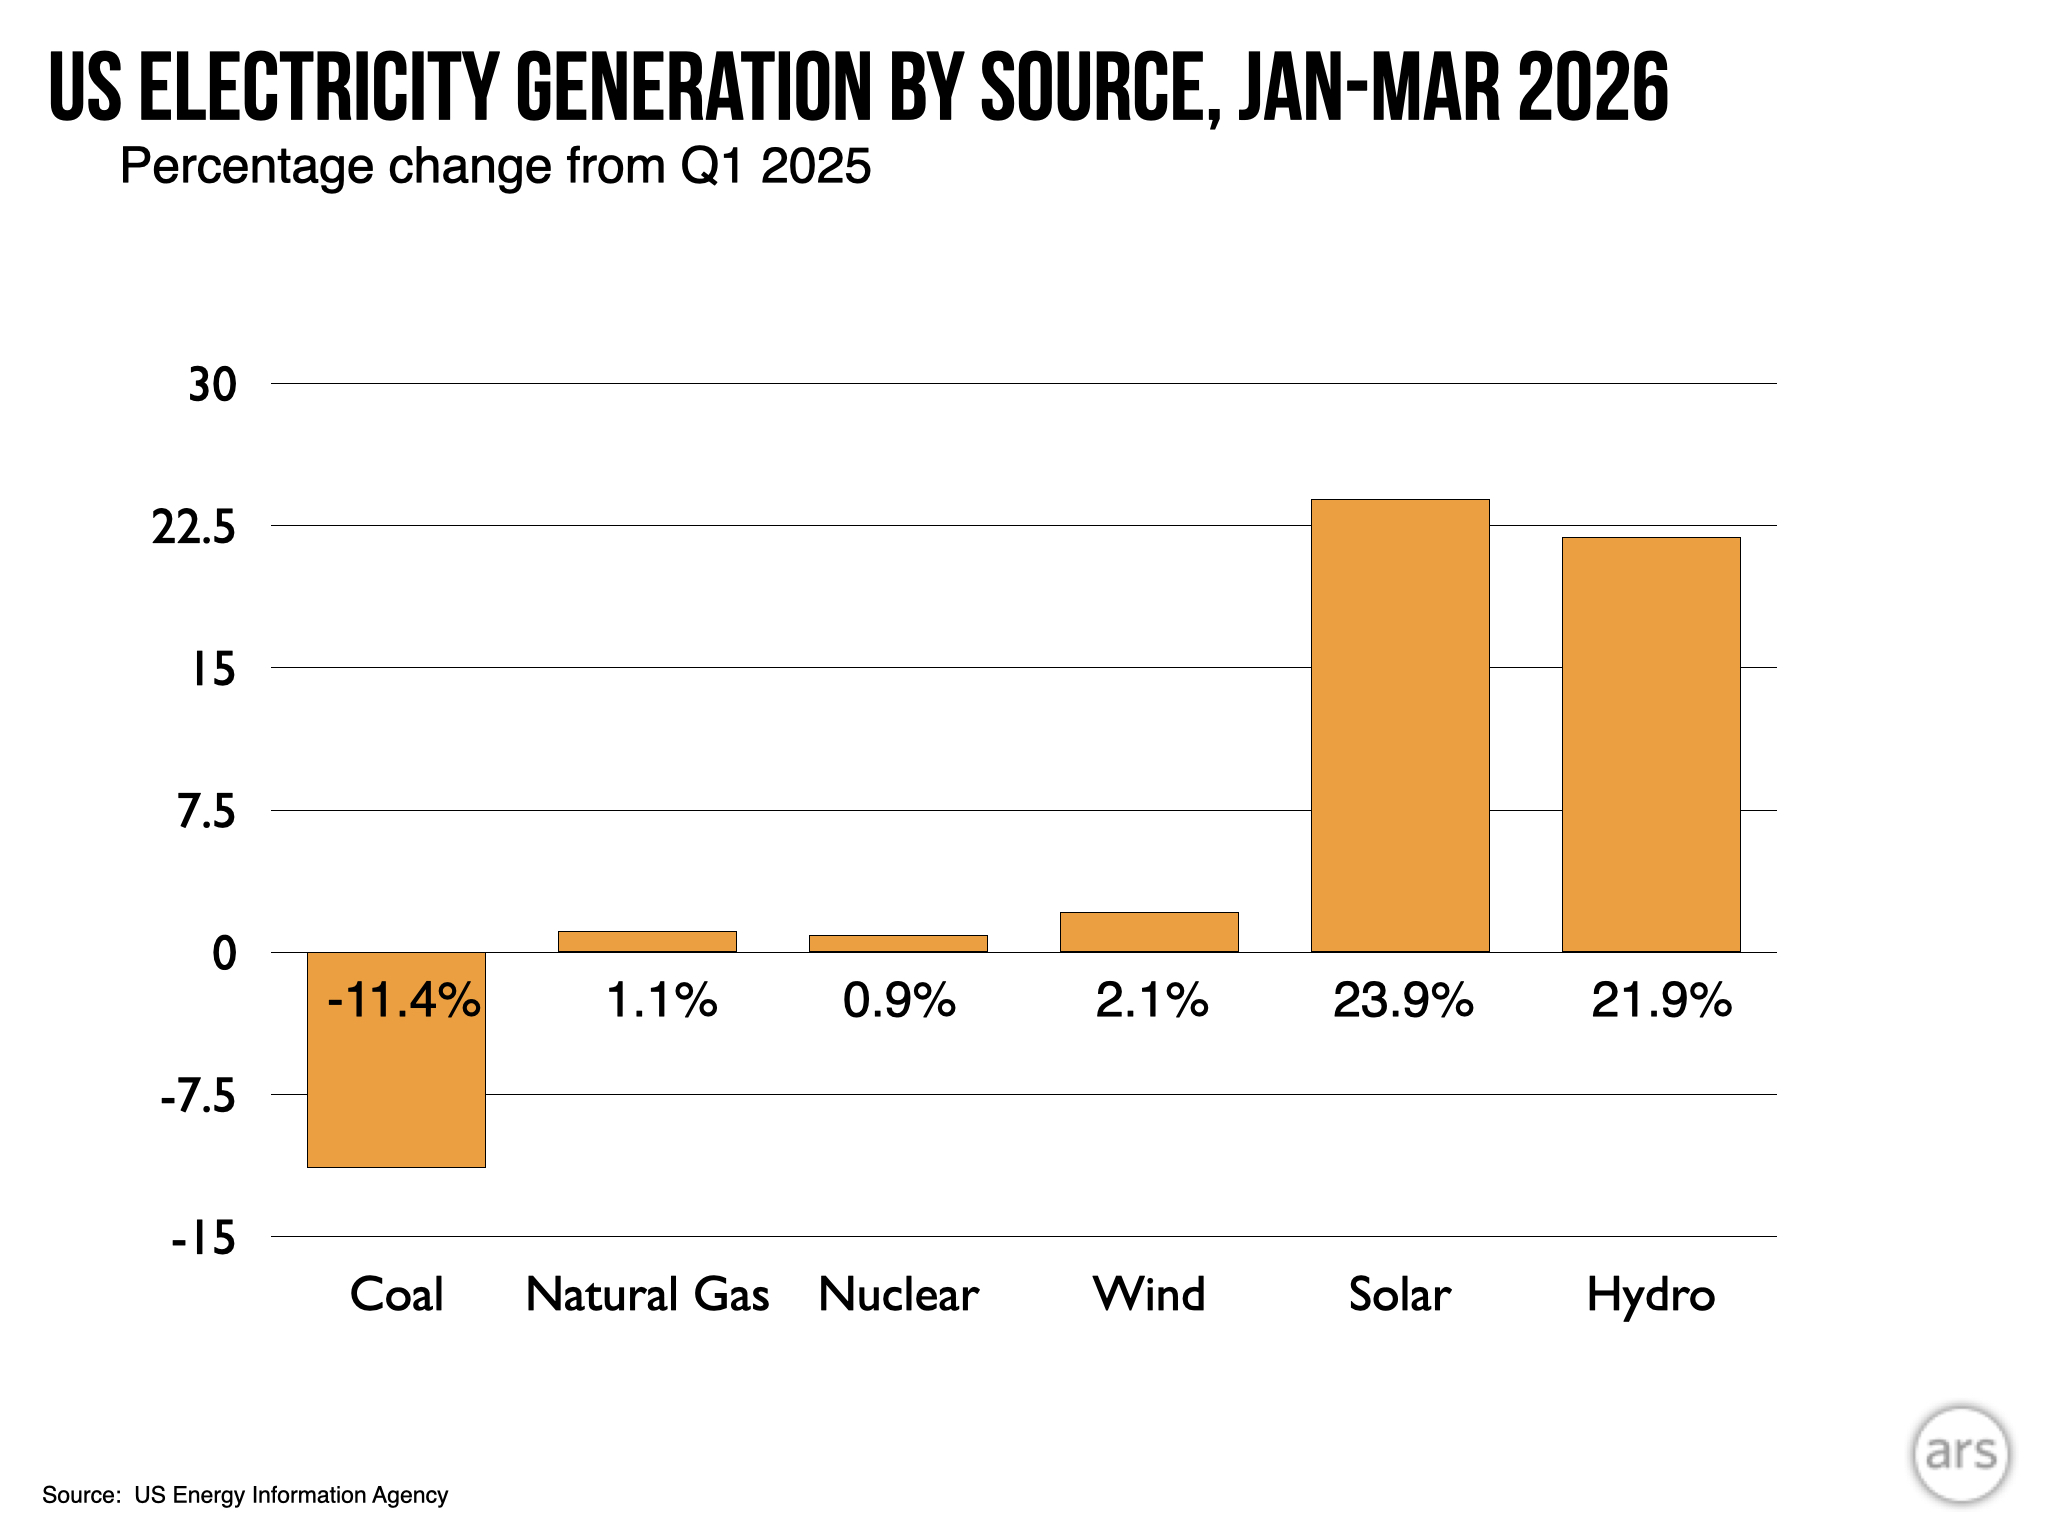
Given that renewable growth greatly exceeded demand, there was nowhere to go for fossil fuels but down. Overall, they saw a drop of about 3 percent year-over-year, with an absolute change similar in magnitude (if not sign) to the growth in demand. But natural gas use actually grew slightly in the first quarter, which meant coal took an even greater hit, with its use dropping by over 10 percent. That may change as the Persian Gulf conflict drives global natural gas prices higher, but it was not yet a major factor in this data.
As mentioned above, the most unusual event was a surge in hydroelectric generation; it rose by 22 percent in the first quarter. In absolute terms, this was about the same as solar growth; in contrast to solar, however, it came without a building boom, as no major new dams have been completed.
This happened at a time when winter temperatures were unusually warm in the west and likely represent the early loss of snowpack. (Though snowpack in the Colorado River basin is unusually low due to a lack of precipitation.) If that turns out to be a major factor, we’ll likely see a relative drop in productivity over the summer and autumn, canceling out the early surge.
Against the current
Overall, fossil fuels continue to generate about half the electricity put onto the grid, a figure that doesn’t change when you account for small-scale solar projects that produce power that never appears on the grid. The three major renewable technologies accounted for more than a quarter of the total. When nuclear power is also considered for emissions-free electricity, the total exceeds 45 percent.
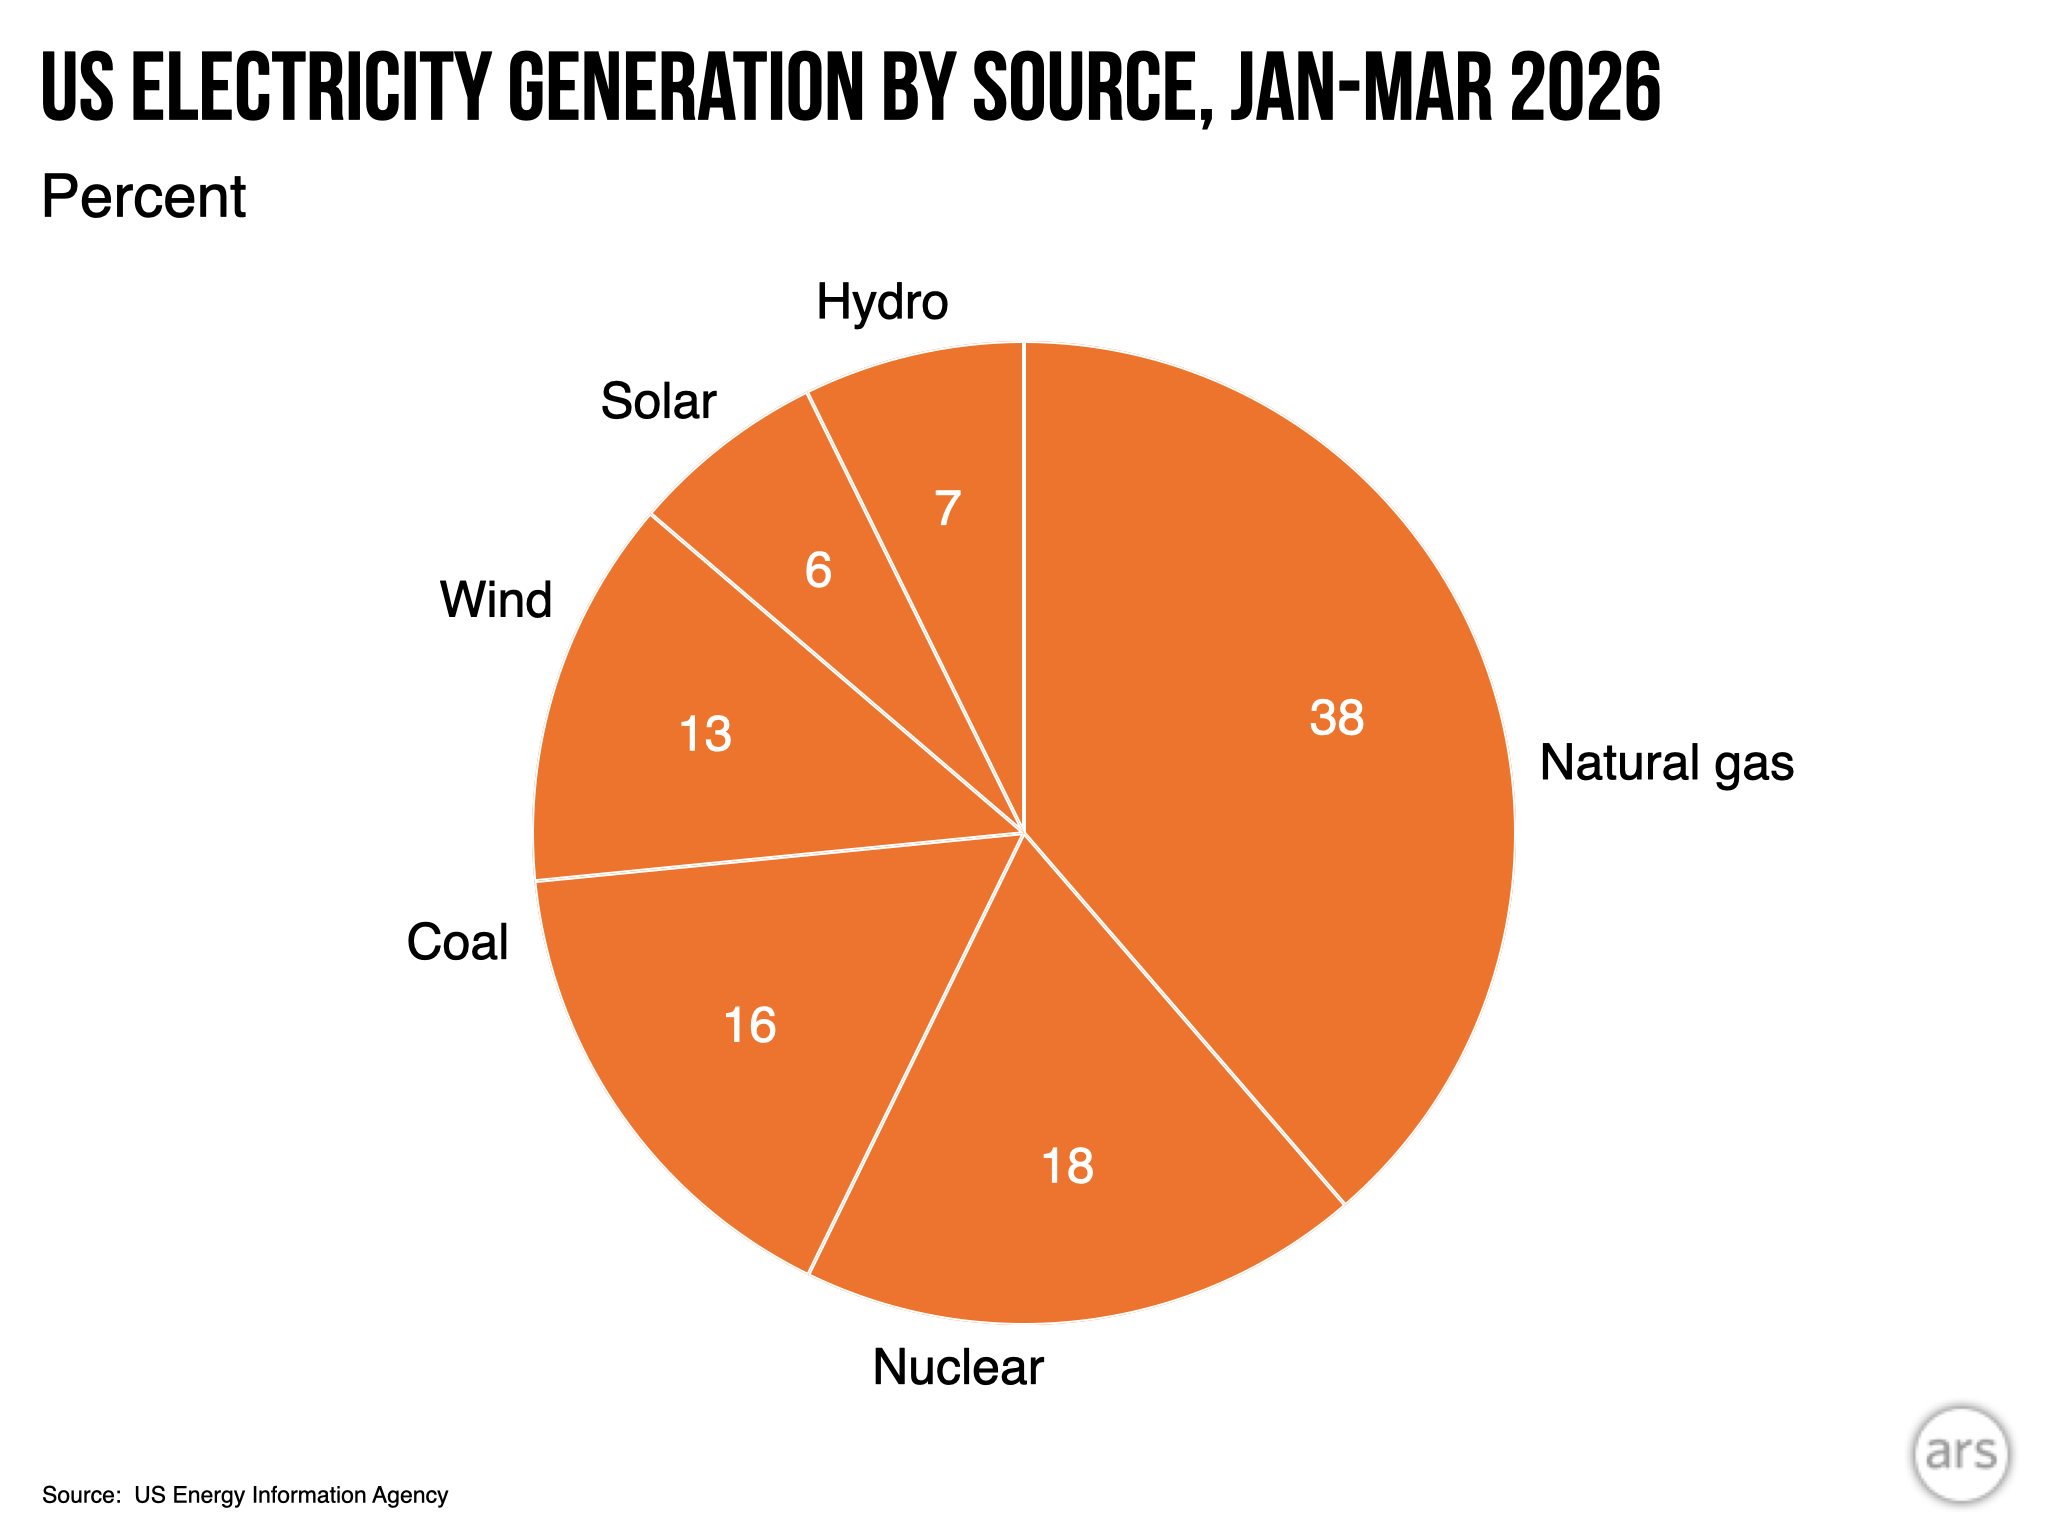
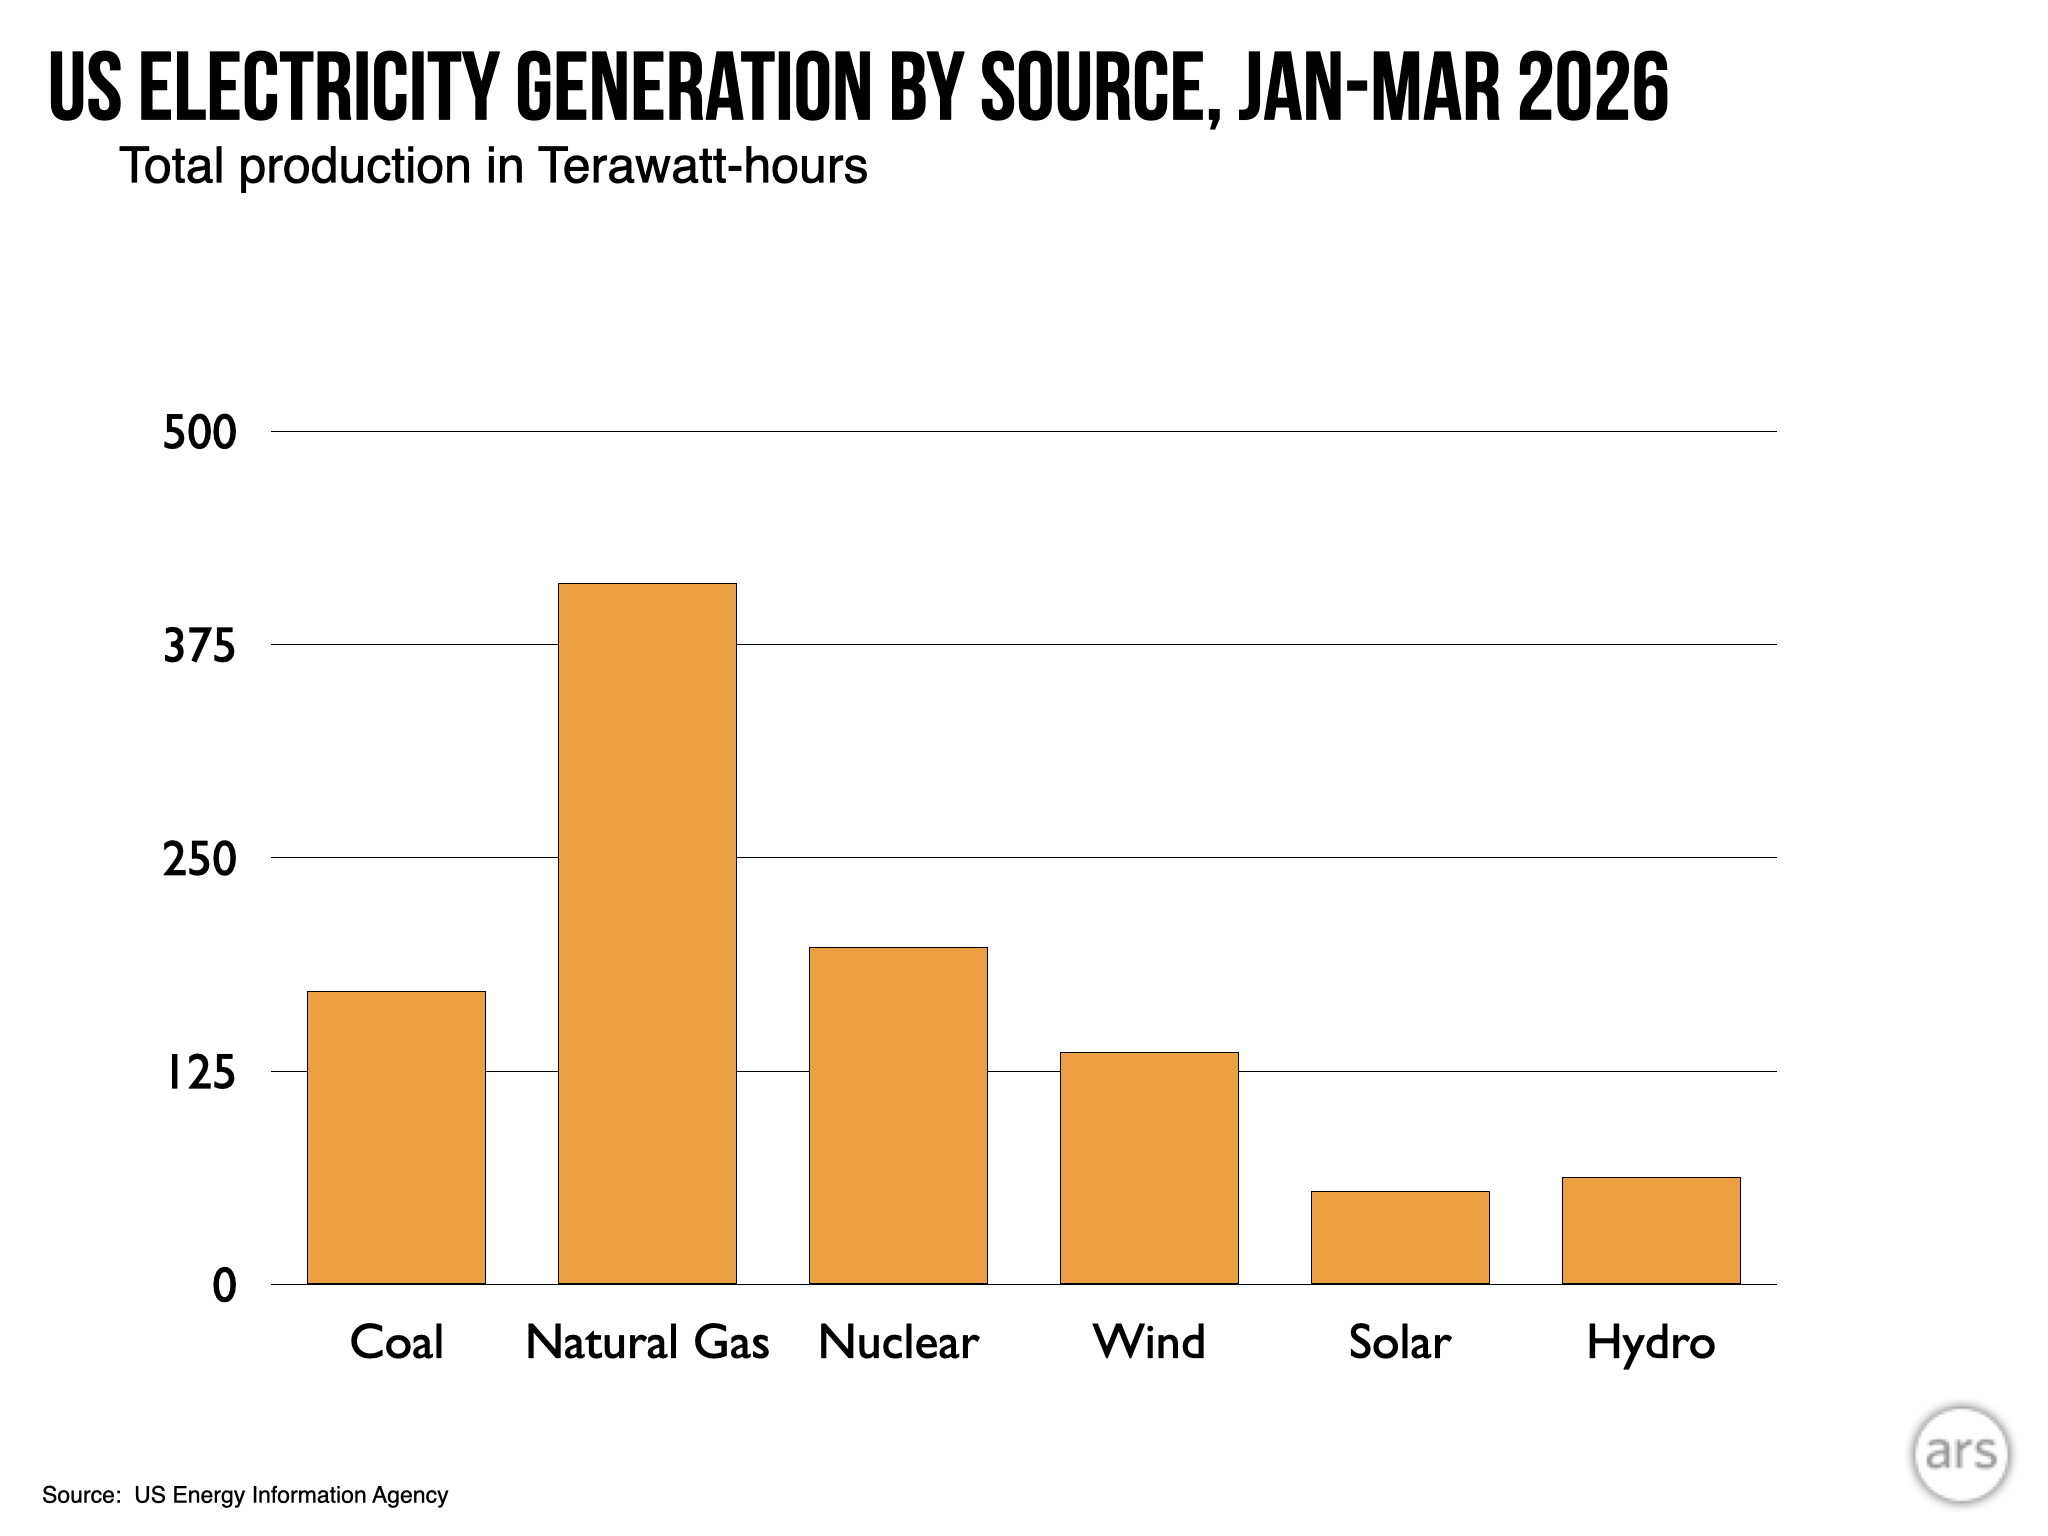
The major change compared to last year’s data is that the surge in hydro moved it slightly ahead of solar, which had passed it as a source of US electricity in 2025. That’s very likely to reverse before the year is over. We’re still building lots of solar projects, its peak months of productivity are just starting, and as mentioned above, hydro is likely to drop considerably before the year is over.
The most notable thing about the trends in generation is how they are roughly the reverse of the Trump Administration’s priorities. Despite multiple attempts to block its development, renewable power continues to grow, and wind is likely to benefit from the opening of the US’s first large offshore wind farms in 2025 and 2026. Meanwhile, coal is dropping even as the administration is ordering plants to stay open past their planned closure dates.
A lawsuit is in progress to challenge the legality of those orders, and the fact that coal is dropping would seemingly support the view that the orders are unnecessary.


